The Impatient List
What would it be like to be waiting for a kidney transplant in the United States?
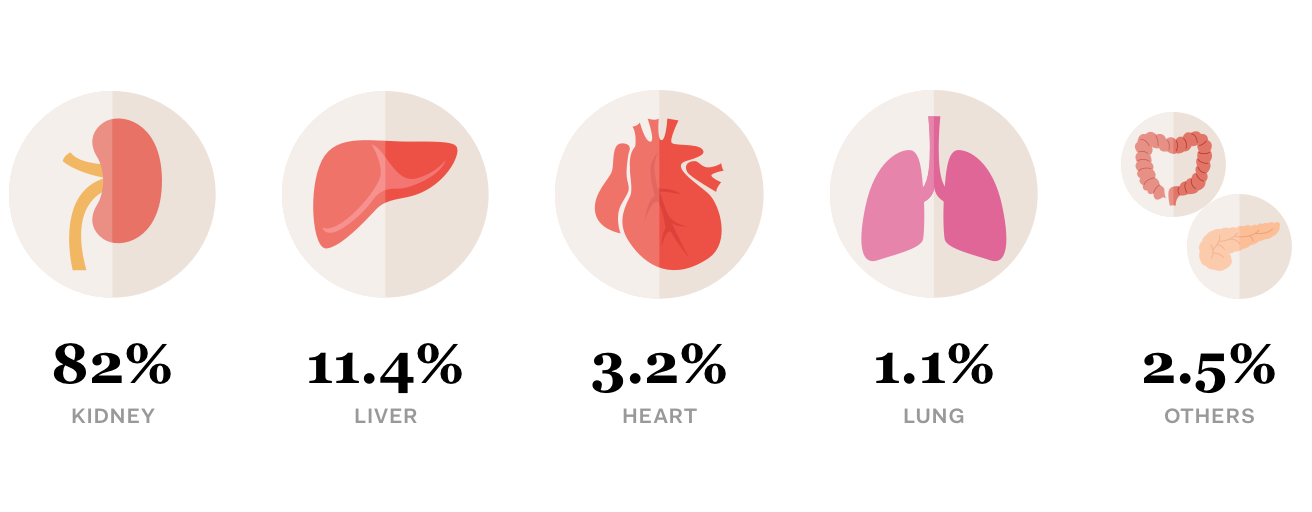
More than 114,000 Americans eligible for organ transplants are waiting for a donation, with 80% of them waiting for a kidney transplant.

The kidneys are two bean-shaped organs located on either side of the spine just below the rib cage. Their main function is to filter and remove excess waste, minerals and fluid from the blood by producing urine.
When your kidneys lose this filtering ability, harmful levels of fluid and waste accumulate in your body, which can raise your blood pressure and result in kidney failure (end-stage renal disease, which is also known as end-stage kidney disease). End-stage renal disease occurs when the kidneys have lost about 90 percent of their ability to function normally. They can be caused by diabetes, chronic, uncontrolled high blood pressure, polycystic kidney disease, etc.
When your kidneys fail, kidney transplant is one of two ways to replace the work your own kidneys can no longer do. Compared to its alternative, dialysis, kidney transplant offers more freedom and better quality of life.
However, getting a transplant is not easy.
To receive a transplant, you must first register yourself on the waitlist of a transplant center. There are 237 of them across the United States.
Since Kidney Transplant can be time sensitive, it is best for you to choose the ones adajacent to where you live. Please enter your zip code to view centers around you:
You’ll also need to compare between centers around you for their death rates, survival rates, and waitlist waiting time, in order to find the optimal center to register as a candidate. How would you balance these different factors, when each choice you make might influence your chance of getting a transplant to being cured?
Click on each pin on the map to view the data for each center compared to other centers around you.
Currently, your state has 4,123 patients like you, waiting for a kidney transplant. 42 % of them have already been waiting for over 2 years
The situation is even worst in other parts of the country.
Georgia
Georgia has 4,796 waiting for a kidney transplant. 39% of them have already been waiting for over 3 years.
California
California has the longest waiting list of 19,723 patients, which is the highest in the nation even after population is considered. 44% of those patients have been waiting for over 3 years.
Alabama
Alabama’s patients tend to wait the longest, with 63% of them staying on the waitlist for over 3 years, almost twice the amount of the national average (34%).
Waitlist length is only part of the story, since different states have different populations and donor registration rates. In addition, donors and recipients need to have compatible blood types, and similar body size (BMI).
What if we consider the ratio between the waitlist and donors for each state, and separate the results by blood type & BMI?